Diabetes Prediction using Machine Learning
Diabetes Mellitus (shortly known as Diabetes) is one of the fastest-growing diseases. Nowadays, many people are affected with diabetes for many reasons, irrespective of age. Recently, many people who belong to a smaller age group are also involved with diabetes for reasons like lack of physical exercise, not taking a nutritious diet, genetic disorders by birth, etc.

According to records, around 42 crore people are suffering with diabetes across the world. In India, eight crore people are concerned with diabetes. This says that about 19% of the entire world's diabetic patients are in India.
What is Diabetes?
Diabetes is a long-lasting disease that affects when the glucose (or sugar) levels in our blood are very high.
When we consume food, it gets converted into sugar after digestion and mixed with blood in our body. When the sugar levels in our blood are high, the pancreas releases a hormone known as insulin, but in the case of diabetic patients, the pancreas will not release enough insulin or will not release it at all. In this case, the blood with high sugar levels flows into different organs of our body, like the heart, kidneys, etc. And causes serious health problems like heart attack, kidney failure, and other related diseases.
Diabetes can be classified into two types. They are,
- Type – 1
- Type – 2
In Type – 1 Diabetes, the pancreas, which is responsible for producing insulin, does not produce any insulin. This occurs when our immune system destroys the insulin-producing cells in the pancreas. The reasons behind affecting with Type -1 Diabetes are genetic disorders.
In Type – 2 Diabetes, the pancreas does not produce required or sufficient insulin, or the body does not utilize the produced insulin well. This can be caused because of obesity and not performing any physical exercise.
Machine Learning in Diabetes Prediction:
In practice, diagnosing diabetes by hospitals and diagnosis centers is done by collecting blood samples from patients and performing various tests on those samples. By examining the sugar levels in the blood, the doctors predict whether the patient got affected with diabetes or not.
But nowadays healthcare sector has many databases storing data on all kinds of diseases. On proper data analysis, one can identify the patterns among the data points, figure out the relevant features in the vast dataset and finally predict the output values for the given dataset.
Here comes the role of machine learning. We load the dataset, perform various data cleaning techniques, select relevant features and suitable machine learning algorithms, and predict the output.
Broadly, machine learning algorithms are classified into two categories. They are,
- Regression
- Classification
Regression is used for prediction if the dependent variable (output) is a continuous value. If we want to predict the sugar levels in our blood for the given input values, then we can use regression algorithms.
Classification is used when the dependent variable (output) is categorical (discrete). In the case of diabetes prediction, based on the input values, if we want to classify whether the person got affected with diabetes or not (yes or no), then we can use classification algorithms.
Based on the availability of target values (dependent variables) in the dataset, we can broadly classify machine learning algorithms into two types. They are,
- Supervised Learning Algorithms
- Unsupervised Learning Algorithms
We use supervised learning algorithms in the labelled dataset (i.e., a dataset with a dependent variable). And unsupervised in the case of datasets without labels.
Some of the Supervised Classification algorithms are Decision Tree Classifier, Support Vector Classifier, Logistic Regression, Random Forest Classifier, etc. And Supervised Regression algorithms are Linear Regression, Support Vector Regressor, Decision Tree Regressor, Random Forest Regressor, etc.
Some Unsupervised learning algorithms that can be used for our diabetes prediction are K-Means Clustering, Hierarchical Cluster Analysis, etc.
Now let us look at some relevant features for diabetes prediction.
Some Important Features for Diabetes Prediction are:
- Age
- Gender
- BMI
- Blood Pressure
- Glucose
- Insulin
- Skin Thickness
- Number of times Pregnant
These are some regular features we consider while training our machine learning model for diabetes prediction. Along with these, we must consider a few external features to get a better forecast.
Age:
It is a numerical (integer) datatype. It refers to the age of a person.
Gender:
Gender is a categorical data type. It can be a string (Male/Female), or it can be a number (0/1).
BMI:
BMI stands for Body Mass Index. It can be calculated by using the formula,
BMI = kg/m2
where kg is the weight of a person in kilograms and m2 is their height measured in meters squared.
BMI is a numerical (float) datatype.
Blood Pressure:
Blood Pressure is the pressure or the force of blood pushing against the blood vessels. It is measured in millimeters of Hg (mmHg). It is a numerical datatype.
Glucose:
It indicates the amount of sugar/glucose levels in our blood. It is also a numerical datatype.
Insulin:
It indicates the amount of insulin produced by the pancreas in our body. Or the amount of insulin utilized by blood in our body.
It is also the numerical datatype.
Skin Thickness:
Skin Thickness is determined by collagen content. It is a numerical value. It is measured in millimetres.
Number of times Pregnant:
It is related to females. It is a numerical (integer) value.
Sample Diabetes Dataset:
Now, let us implement a machine learning algorithm on the diabetes dataset.
Let us implement the code by taking a sample dataset from the internet.
Program:
#Import requires libraries
import pandas as pd
import numpy as np
import matplotlib.pyplot as plt
import seaborn as sns
from sklearn.preprocessing import StandardScaler
from sklearn.model_selction import train_test_split
from sklearn import metrics
from sklearn.metrics import confusion_matrix
#load the dataset as DataFrame
#here, we are reading the dataset by using read_csv method
df = pd.read_csv(“diabetes.csv”)
df.head(5)
Output:
| Pregnancies | Glucose | blood pressure | skin thickness | Insulin | BMI | DiabetesPedigreeFunction | Age | Outcome | |
| 0 | 6 | 148 | 72 | 35 | 0 | 33.6 | 0.627 | 50 | 1 |
| 1 | 1 | 85 | 66 | 29 | 0 | 26.6 | 0.351 | 31 | 0 |
| 2 | 8 | 183 | 64 | 0 | 0 | 23.3 | 0.672 | 32 | 1 |
| 3 | 1 | 89 | 66 | 23 | 94 | 28.1 | 0.167 | 21 | 0 |
| 4 | 0 | 137 | 40 | 35 | 168 | 43.1 | 2.288 | 33 | 1 |
Input:
#data analysis
print(type(df))
Output:
<class 'pandas.core.frame.DataFrame'>
Here, we observe that the data type of the variable “df” is DataFrame. Whenever we read the dataset using read_csv method, it loads the dataset as DataFrame.
Input:
print(df.columns)
Output:
Index(['Pregnancies', 'Glucose', 'BloodPressure', 'SkinThickness', 'Insulin','BMI', 'DiabetesPedigreeFunction', 'Age', 'Outcome'],
dtype='object')
Input:
#let us check for null values in the dataset
print(df.isnull().sum())
Output:
Pregnancies                 0
Glucose                     0
blood pressure              0
SkinThickness               0
Insulin                     0
BMI                         0
DiabetesPedigreeFunction    0
Age                         0
Outcome                     0
dtype: int64
Input:
#let us look for the datatypes of each column
print (df.info ())
Output:
<class 'pandas.core.frame.DataFrame'>
RangeIndex: 768 entries, 0 to 767
Data columns (total 9 columns):
 #   Column                    Non-Null Count  Dtype
---  ------                    --------------  -----
 0   Pregnancies               768 non-null    int64
 1   Glucose                   768 non-null    int64
 2   BloodPressure             768 non-null    int64
 3   SkinThickness             768 non-null    int64
 4   Insulin                   768 non-null    int64
 5   BMI                       768 non-null    float64
 6   DiabetesPedigreeFunction  768 non-null    float64
 7   Age                       768 non-null    int64
 8   Outcome                   768 non-null    int64
dtypes: float64(2), int64(7)
memory usage: 54.1 KB
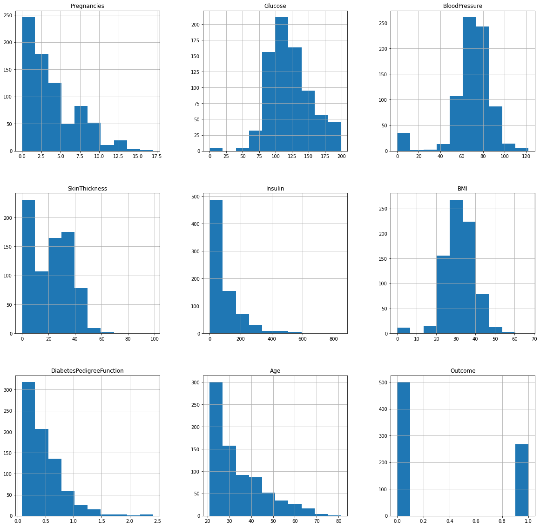
Input:
#data visualization
df. hist(figsize = (20,20))
Output:
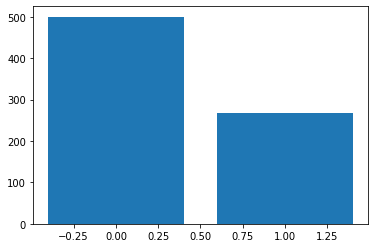
Input:
#let us look if our dataset is balanced or not
print(df.Outcome.value_counts())
x = [0,1]
y =  df.Outcome.value_counts()
plt.bar(x,y)
Output:
0    500
1    268
Name: Outcome, dtype: int64
<BarContainer object of 2 artists>
Input:
#identifying the correlation between all columns
print(df.corr())
Output:
                          Pregnancies   Glucose  BloodPressure  SkinThickness  \
Pregnancies                  1.000000  0.129459       0.141282      -0.081672
Glucose                      0.129459  1.000000       0.152590       0.057328
BloodPressure                0.141282  0.152590       1.000000       0.207371
SkinThickness               -0.081672  0.057328       0.207371       1.000000
Insulin                     -0.073535  0.331357       0.088933       0.436783
BMI                          0.017683  0.221071       0.281805       0.392573
DiabetesPedigreeFunction    -0.033523  0.137337       0.041265       0.183928
Age                          0.544341  0.263514       0.239528      -0.113970
Outcome                      0.221898  0.466581       0.065068       0.074752


                           Insulin       BMI  DiabetesPedigreeFunction  \
Pregnancies              -0.073535  0.017683                 -0.033523
Glucose                   0.331357  0.221071                  0.137337
BloodPressure             0.088933  0.281805                  0.041265
SkinThickness             0.436783  0.392573                  0.183928
Insulin                   1.000000  0.197859                  0.185071
BMI                       0.197859  1.000000                  0.140647
DiabetesPedigreeFunction  0.185071  0.140647                  1.000000
Age                      -0.042163  0.036242                  0.033561
Outcome                   0.130548  0.292695                  0.173844


                               Age   Outcome
Pregnancies               0.544341  0.221898
Glucose                   0.263514  0.466581
BloodPressure             0.239528  0.065068
SkinThickness            -0.113970  0.074752
Insulin                  -0.042163  0.130548
BMI                       0.036242  0.292695
DiabetesPedigreeFunction  0.033561  0.173844
Age                       1.000000  0.238356
Outcome                   0.238356  1.000000
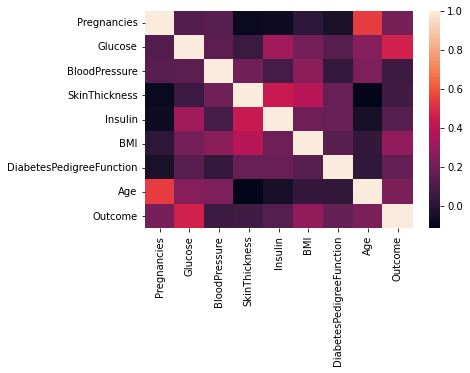
Input:
sns.heatmap(df.corr())
Output:
Input:
#splitting the dataset
X = df.drop(“Outcome”, axis=1)
y =  df[“Outcome”]
X_train, X_test, y_train, y_test = (X, y, test_size = 0.2, random_state=12)


#using LogisticRegression() Machine Learning Algorithm
from sklearn.linear_model import LogisticRegression
regr = LogisticRegression()
regr.fit(X_train,y_train)
#predicting the output values for the testing set
y_pred = regr.predict(X_test)
#constructing the confusion matrix for y_test and y_pred
print(confusion_matrix(y_test,y_pred))
Output:
[[96  8]
 [6 44]]