Text box with Line Wrapping in Matplotlib
Matplotlib in Python
The visual representation of data is more adaptable to human brains than text-based data. When something is pictured, it is much easier to understand. Showing the data as a graph is preferable, allowing for more effective data analysis and targeted decision-making. Thus, Python gives various libraries for data visualization, including matplotlib, seaborn, etc. Matplotlib is a Python package used for creating visualizations to make things easy to learn and more interactive.
The matplotlib library is used for static, creative, animate, and interactive visualizations. It offers a variety of ways to annotate and describe the plot textually. Additionally, it can automatically enclose the text.
The text serves a variety of functions in a plot. The text also draws the reader's attention, provides general observations, and describes the plot. Text-adding techniques are available in Matplotlib for plots.
Steps to add text to a plot
- Importing the required library
- Creating the data for the plot
- Plotting the data
- Add the text to the plot using the text() function
- Displaying the plot
Methods and Functions to add text in a Plot
text() Function in Matplotlib
text() is an in-built function in matplotlib used to add text in a plot at x and y coordinates in arbitrary locations.
Syntax of text() function
matplotlib.pyplot.text(x, y, sr, font= None, **args)
In this,
- x and y are floating numbers that indicate the position or coordinates of the plot where the text is to be placed.
- s is the text which is to be inserted into the plot. It is in the form of a string.
- font is a dictionary to change the text’s default features. By default, it is set to none and can be determined by rcParams.
- **args are the text properties.
Let’s explore the text() function to add text to the plot through a few examples in matplotlib
Example 1: A simple program to add text in a plot using text() in Python
Code
import matplotlib.pyplot as plt               # importing library

plt.text(0.2, 0.1, "First Text")      # setting the coordinates and the text

plt.savefig("txt.png")                                 # saving the plot as a png image
Output

Explanation
In this code, firstly, the matplotlib.pyplot library is imported, and an object plt is made. Then using the text() function, a text “First Text” is added to the (0.2, 0.1) coordinates of the plots. Then the plot is saved using the savefig() function as txt.png.
Example 2: Program to add text with labels in the plot using text() function in matplotlib
Code
import matplotlib.pyplot as plt

x = [1, 2, 3, 4, 5]

y = [40, 20, 50, 70, 10]

y2 = [90, 10, 25, 40, 60]

plt.plot(x, y, 'r', label= 'line 1', linewidth=10)

plt.plot(x, y2, 'g', label= 'line 2', linewidth=10)

plt.title('Running details in line plot')

plt.ylabel('Distance covered')

plt.xlabel('Time')

plt.text(3, 40, "Player 1")

plt.text(2.5, 55, "Player 2")

plt.savefig("Plt.png")

plt.legend()
Output
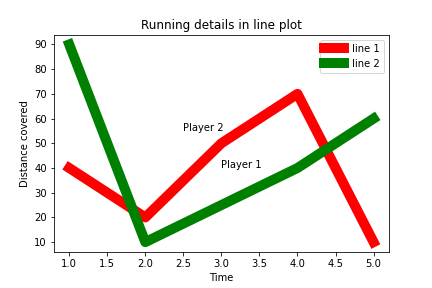
In this plot, a plot of two lines between the distance and time of two players is shown. The labels are marked using the label() function on both axes, and the text is inserted using the text() function.
figtext () function in matplotlib
figtext() is an in-built function in matplotlib used to add text in a plot at x and y coordinates in any location. It is a substitute or alternative to the text() function. Text can also be added outside the axes of the plot.
Syntax of figtext() function in matplotlib
matplotlib.pyplot.figtext(x, y, str, font=None, **args)
In this,
- x and y are floating numbers that indicate the position or coordinates of the plot where the text is to be placed.
- s is the text which is to be inserted into the plot. It is in the form of a string.
- font is a dictionary to change the text’s default features. By default, it is set to none and can be determined by rcParams.
- **args are the text properties.
Let’s explore the figtext() function to add text to the plot through a few examples in matplotlib
Example 3: A simple program to add text in a plot using figtext() in Python
Code
import matplotlib.pyplot as plt                         # importing library

x = [1, 2, 3, 4, 5]

y = [50, 40, 40, 80, 20]

plt.plot(x, y, 'g', linewidth=5)

plt.figtext(0.25, 0.5, "Text using figtext()")     # setting the coordinates and the text

plt.savefig("txt2.png")                                         # saving the plot as a png image
Output
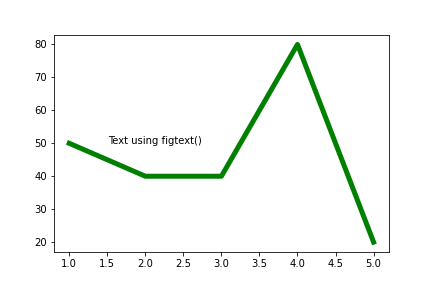
In this code, firstly, the matplotlib.pyplot library is imported, and an object plt is made. A plot between x and y with different points is made. Then using the figtext() function, a text “Text using figtext()” is added to the (0.25, 0.5) coordinates of the plots. Then the plot is saved using the savefig() function as txt2.png.
Text box with line wrapping using text() function in matplotlib
We can add text without any axis in different directions and forms.
Example 4: Program to add a text box with line wrapping using the text() function
Code
import matplotlib.pyplot as plt

f = plt.figure()

plt.axis([0, 10, 0, 10])

txt = ("Text wrapping")

plt.text(5, 8, txt, fontsize=20, style='oblique', ha='center', va='top', wrap=True)

plt.show()

plt.savefig("wrap.png")
Output

In this, we have wrapped the text in the center position with a font size of 20 and the text style oblique.
Customizations in the text box with line wrapping in matplotlib
We can change the positioning of text along with its text style and font.
Let’s explore more with a few examples.
Example 5: Font: Italic, Text size: 24, Position: left bottom
Code
import matplotlib.pyplot as plt

f = plt.figure()

plt.axis([0, 10, 0, 10])

txt = ("Text wrapping")

plt.text(0, 1, txt, fontsize=24, style='italic', ha='left', va='baseline', wrap=True)

plt.savefig("wrap2.png")

plt.show()
Output

Example 6: Rotating the text
Code
import matplotlib.pyplot as plt

f = plt.figure()

plt.axis([0, 10, 0, 10])

txt = ("Text wrapping")

plt.text(3, 4, txt, fontsize=24, style='italic', rotation=25, ha='center', va='top', wrap=True)

plt.savefig("wrap3.png")

plt.show()
Output

Example 7: Adding a long string in different directions with different styles
Code
import matplotlib.pyplot as plt

fig = plt.figure()

plt.axis([0, 50, 0, 50])

txt = ("A long string to display.... Can't fit in one axis...."

        "Can move in any direction.."

         "Illustrating text box with line wrapping in matplotlib")

plt.text(4, 1, txt, ha='left', rotation=15, wrap=True)

plt.text(6, 5, txt, ha='left', rotation=15, wrap=True)

plt.text(15, 15, txt, ha='right', rotation=-15, wrap=True)

plt.text(5, 20, txt, fontsize=18, style='oblique', ha='center',

         va='top', wrap=True)

plt.text(3, 4, txt, family='serif', style='italic', ha='right', wrap=True)

plt.text(-1, 0, txt, ha='left', rotation=-15, wrap=True)

plt.savefig("wrap5.png")

plt.show()
Output

We have wrapped a long text into a plot with different fonts, styles, and positions.