K-Means Clustering on the Handwritten Digits Data using Scikit Learn in Python
What is k-means Clustering?
A well-liked unsupervised machine learning approach called K-means clustering is used to cluster or organize data points into discrete groups based on their similarity. The sum of squared distances between the data points and their cluster centroids, or the within-cluster variance, is what the method seeks to minimize.
Use of k-means:
K-means clustering divides data points into discrete groups based on similarity and is typically used for unsupervised machine-learning tasks. Here are some typical K-means clustering use cases and applications:
- K-means clustering may divide clients into categories based on their demographics, purchasing patterns, or other characteristics. Businesses may use this information to customize their marketing plans and offerings for each consumer category.
- K-means clustering may compress photos by minimizing the number of colors used. The algorithm produces a compressed image with less storage space, which determines representative colors and assigns each pixel to the nearest representation.
- Anomaly Detection: By locating typical clusters in a dataset, K-means clustering can assist in identifying anomalies or outliers that deviate from the norm. These abnormalities might result from fraud, system flaws, or other inconsistencies in various fields.
- Information retrieval, topic modeling, and document organization are all made more accessible by K-means clustering, which groups documents based on their content or similarity.
- Market Basket Analysis: Using K-means clustering, connections or trends in client purchase data may be found. It can reveal product categories regularly purchased collectively, enabling targeted cross-selling and recommendation systems.
- K-means clustering may divide photos into several parts or areas based on how closely their colors or textures match. Computer vision, object identification, and image processing jobs can all benefit from this method.
- Gene Expression Analysis: K-means clustering may analyze gene expression data to find gene groups that express similarly, which can help understand gene function, classify diseases, and find new drugs.
- K-means clustering may be used in social network analysis to classify users or nodes according to their connections, interests, or behavior. Detecting influencers, locating communities, and customizing suggestions can all be aided by this.
These are just a few examples of the many fields in which K-means clustering may be used. It is a well-liked option for clustering assignments because of its simplicity, interpretability, and efficiency.
Here's an example of how you can perform K-means clustering on the handwritten digits dataset using Scikit-Learn in Python:
from sklearn.datasets import load_digits
import matplotlib.pyplot as plt
from sklearn.cluster import KMeans
from sklearn.preprocessing import scale
from sklearn.decomposition import PCA
from time import time
import numpy as np
from sklearn import metrics
# Load the digits dataset
digits = load_digits()
# Extract the data and target labels
data = digits.data
target = digits.target
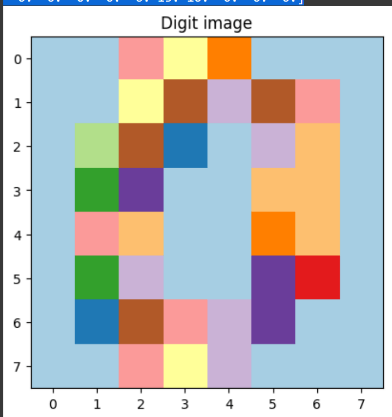
print("First handwritten digit data:", data[0])
sample_digit = data[0].reshape(8, 8)
plt.imshow(sample_digit)
plt.title("Digit image")
plt.show()
# Scale the data
scaled_data = scale(data)
k = 10
kmeans = KMeans(init="random", n_clusters=k, n_init=10, random_state=0)
def evaluate_kmeans(estimator, name, data):
initial_time = time()
estimator.fit(data)
print("K-means initialization:", name)
print("Time taken: {:.3f}".format(time() - initial_time))
print("Homogeneity: {:.3f}".format(metrics.homogeneity_score(target, estimator.labels_)))
print("Completeness: {:.3f}".format(metrics.completeness_score(target, estimator.labels_)))
print("V_measure: {:.3f}".format(metrics.v_measure_score(target, estimator.labels_)))
print("Adjusted random: {:.3f}".format(metrics.adjusted_rand_score(target, estimator.labels_)))
print("Adjusted mutual info: {:.3f}".format(metrics.adjusted_mutual_info_score(target, estimator.labels_)))
print("Silhouette: {:.3f}".format(metrics.silhouette_score(data, estimator.labels_, metric='euclidean', sample_size=300)))
kmeans = KMeans(init="random", n_clusters=k, n_init=10, random_state=0)
evaluate_kmeans(estimator=kmeans, name="random", data=data)
kmeans = KMeans(init="k-means++", n_clusters=k, n_init=10, random_state=0)
evaluate_kmeans(estimator=kmeans, name="k-means++", data=data)
# Reduce the dataset using PCA
pca = PCA(n_components=2)
reduced_data = pca.fit_transform(data)
kmeans.fit(reduced_data)
# Calculate the centroids
centroids = kmeans.cluster_centers_
labels = kmeans.fit_predict(reduced_data)
unique_labels = np.unique(labels)
# Plot the clusters with labels
plt.figure(figsize=(8, 8))
for i in unique_labels:
plt.scatter(reduced_data[labels == i, 0], reduced_data[labels == i, 1], label='Cluster {}'.format(i))
plt.scatter(centroids[:, 0], centroids[:, 1], marker='x', s=169, linewidths=3, color='k', zorder=10)
plt.legend()
plt.title('K-means Clustering of Handwritten Digits')
plt.xlabel('Principal Component 1')
plt.ylabel('Principal Component 2')
plt.show()
Output:
First handwritten digit data: [ 0.  0.  5. 13.  9.  1.  0.  0.  0.  0. 13. 15. 10. 15.  5.  0.  0.  3.

 15.  2.  0. 11.  8.  0.  0.  4. 12.  0.  0.  8.  8.  0.  0.  5.  8.  0.

  0.  9.  8.  0.  0.  4. 11.  0.  1. 12.  7.  0.  0.  2. 14.  5. 10. 12.

  0.  0.  0.  0.  6. 13. 10.  0.  0.  0.]
K-means initialization: random

Time taken: 2.442

Homogeneity: 0.739

Completeness: 0.748

V_measure: 0.744

Adjusted random: 0.666

Adjusted mutual info: 0.741

Silhouette: 0.171

K-means initialization: k-means++

Time taken: 1.755

Homogeneity: 0.742

Completeness: 0.751

V_measure: 0.747

Adjusted random: 0.669

Adjusted mutual info: 0.744

Silhouette: 0.186
The code carries out k-means clustering on a collection of handwritten digits. The first digit's picture is shown after loading the dataset for numbers. The data is then scaled to make its characteristics consistent. The code defines a K-means clustering model with a predetermined number of clusters.
The performance of the K-means model is then evaluated using a function named evaluate_kmeans(). It determines the number of assessment criteria, including silhouette score, adjusted mutual information, adjusted rand index, homogeneity, completeness, and V-measure. The model, the name of the initialization technique, and the data are all inputs to the function.
The "random" and "k-means++" initialization techniques are used to assess the K-means model twice. The evaluation findings, which offer perceptions of the caliber of the clustering outcomes, are printed.
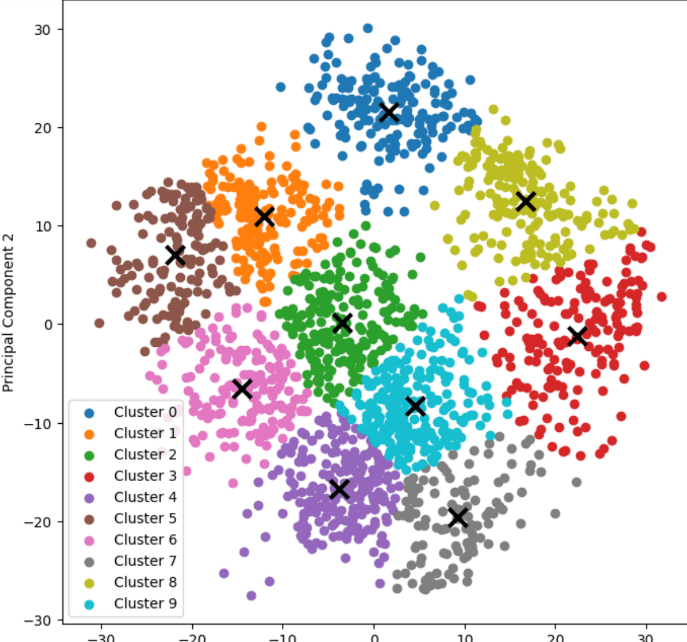
The data's dimensionality is then reduced to 2 dimensions using PCA (Principal Component Analysis). The centroids and anticipated labels for the data points are generated when the reduced data is fitted to the K-means model.
The clusters are then displayed in a scatter plot with a distinct color for each cluster to symbolize it. An 'x' denotes the centroids. The clusters created by the K-means algorithm are visualized in the plot.