Clustering Text Documents using K-Means in Scikit Learn
Clustering is a technique in unsupervised machine learning to group similar data points based on their inherent characteristics or similarities. Finding patterns or structures in the data without labels or target variables is the aim of this type of exploratory data analysis.
A dataset is divided into various groups or clusters during the clustering process, and data points inside a cluster are more comparable to one another than those in other clusters. Distance or similarity measures are typically used to calculate how similar two data points are.
K means Clustering:
A well-known unsupervised machine learning approach called K-means clustering divides a dataset into K clusters. It is a centroid-based method that combines related data points depending on their features' similarity.
The "K" in "K-means" represents how many clusters the algorithm must find. You must set this hyperparameter before executing the algorithm. This is how the algorithm operates:
- Initialization: As initial cluster centroids, choose K data points randomly from the dataset.
- Assignment: Based on a distance measure, often Euclidean distance, assign each data point to the nearest centroid.
Calculate the mean of all the data points allocated to each centroid to update the cluster centroids.
Until convergence, repeat Steps 2 and 3: Repeat the assignment and update processes up to a certain number of times or until there is no noticeable change in the centroids.
The K-means method yields a collection of K cluster centroids and labels designating each data point's cluster membership. The within-cluster sum of squared distances, sometimes referred to as inertia or distortion, is what the algorithm seeks to minimize.
K-means clustering offers several benefits, such as simplicity, scalability, and effectiveness. It does have some drawbacks, though, such as its sensitivity to the initial centroid choice, the requirement to predetermine the number of clusters, and its susceptibility to outliers.
Before employing K-means clustering, it is crucial to properly preprocess the data and select an outstanding K value based on domain expertise or using assessment metrics like the silhouette coefficient or elbow technique.
Code:
import pandas as pd

from sklearn.feature_extraction.text import TfidfVectorizer

from sklearn.cluster import KMeans

from sklearn.decomposition import PCA

import matplotlib.pyplot as plt

# Load the Excel data file

data = pd.read_excel('data.xlsx')

# Extract the ideas from the 'Idea' column

corpus = data['Idea'].astype(str).tolist()

# TF-IDF Vectorizer

vectorizer = TfidfVectorizer()

X = vectorizer.fit_transform(corpus)

# K-Means Clustering

num_clusters = 2 # Update to 3 clusters

km = KMeans(n_clusters=num_clusters)

km.fit(X)

clusters = km.labels_.tolist()

# Perform dimensionality reduction using PCA

pca = PCA(n_components=2) # Change to 3 for 3D visualization

reduced_features = pca.fit_transform(X.toarray())

# Create a DataFrame with reduced features and corresponding cluster labels

ideas_cluster = {'Cluster': clusters, 'PC1': reduced_features[:, 0], 'PC2': reduced_features[:, 1]}

frame = pd.DataFrame(ideas_cluster)

# Plot the clusters

plt.scatter(frame['PC1'], frame['PC2'], c=frame['Cluster'], cmap='viridis')

plt.xlabel('Principal Component 1')

plt.ylabel('Principal Component 2')

plt.title('K-Means Clustering of Text Documents')

plt.colorbar()

plt.show()
Output:
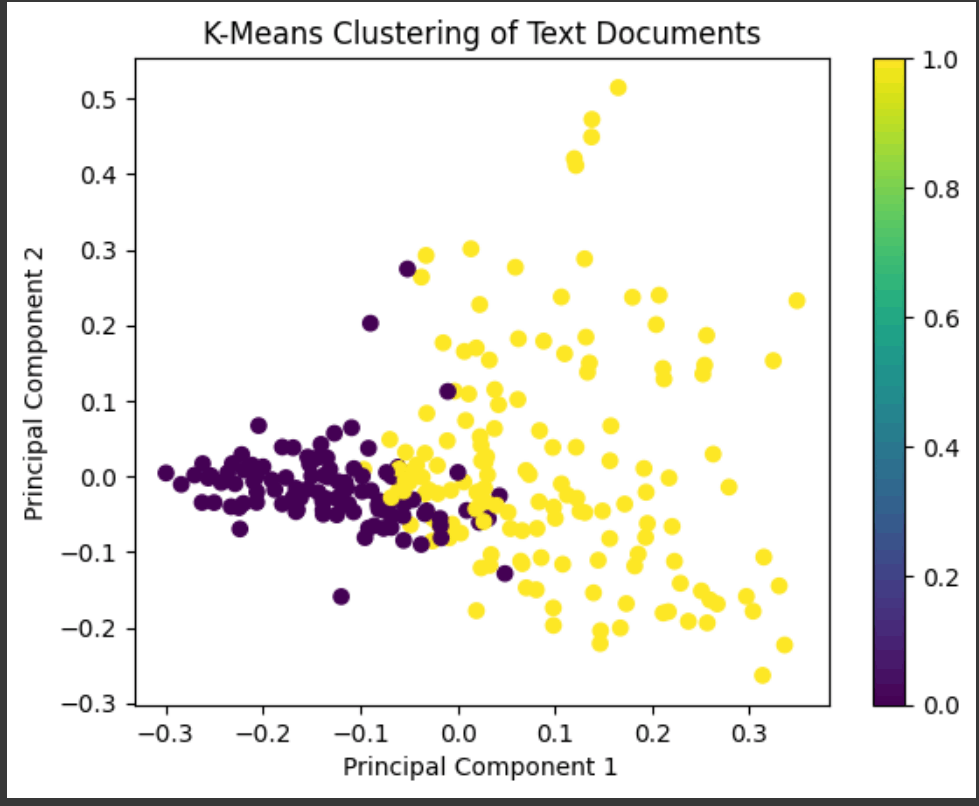
Explaination:
K-means clustering is carried out by the algorithm on a dataset of text documents. The data from an Excel file must first be loaded before the text from the "Idea" column can be extracted. Term Frequency-Inverse Document Frequency (TF-IDF), which weights each term based on its frequency in the document and inverse frequency across all documents, is then used to alter the text.
The data that have been modified using TF-IDF are then clustered using K-means. Although it may be changed as needed, the initial setting for the number of clusters is two. Based on how similar the documents are in the TF-IDF space, the K-means algorithm divides the texts into clusters. Each document has a cluster label attached to it.
Principal Component Analysis (PCA) is used to decrease the dimensionality of the TF-IDF matrix to visualize the clustering findings. This lowers the dimensions of the data to two (PC1 and PC2) for simple visualization, but three can be added for a three-dimensional display. A DataFrame is created by combining the cluster labels and reduced characteristics.
Finally, matplotlib. pyplot is used to produce a scatter plot. Each point in the map represents a document, and its color corresponds to the cluster to which it belongs—the graphic aids in visualizing the clustering of documents according to their TF-IDF representations. The color bar provides a legend for interpreting the cluster labels.